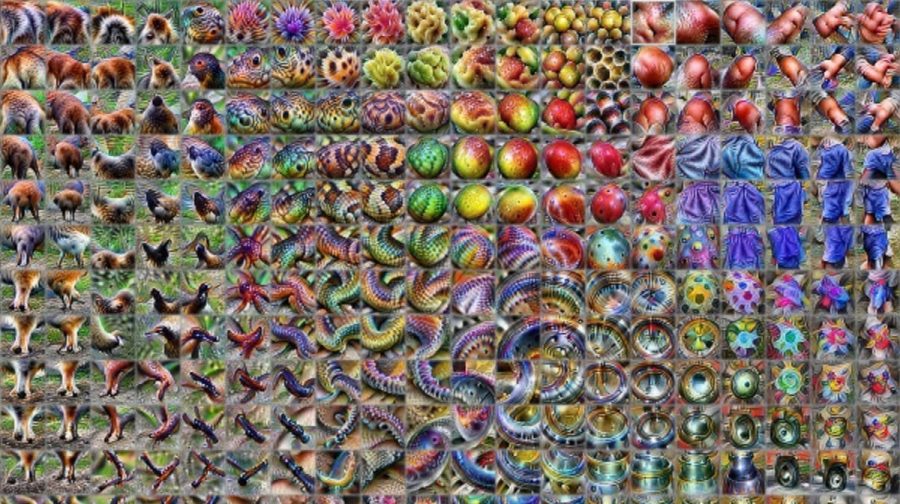
A new tool from Google and OpenAI allows for better visualization and exploration of the representations learned by deep neural networks. The new method, called “Activation Atlases” lets researchers see and analyze internal representations and reveal visual abstractions within models.
Feature visualization is not a completely new topic in Artificial Intelligence. This area was getting more and more attention as the success of visual deep learning was growing. The first initial attempts within feature visualization were trying to visualize individual neurons and their responses.
In a new article, researchers from Google and OpenAI introduced the so-called Activation Atlases – visualizations that provide a bigger picture overview of the neurons activations.
Activation Atlases are showing feature visualizations of averaged neuron activations. As the researchers mention, they took the idea from CNN codes (Karpathy’s CNN visualization) where a dataset is shown organized by individual images’ activation values from a (convolutional) neural network. Instead of showing the dataset, in this approach, the visualization is showing averaged activations of the neurons in the hidden layers.
The ultimate goal, according to the researchers, is to be able to reveal visual abstractions learned by a trained model. Activation Atlases proved that they can provide much more insights into what a neural network is learning. Additionally, they can provide support in examining the latent space and the interpolation properties. One of the final conclusions is that neural activations can be in fact meaningful to humans.
More about Activation Atlases can be read in the official paper. The code was open-sourced and is available here.