FiftyOne is the most convenient way to work with images from Open Images, the largest dataset from Google, widely used in computer vision technologies. The tool’s functionality includes selecting images of a certain type to load, identifying patterns in the data, and visualizing their vector representations.
Open Images is a huge dataset with more than 9 million images, 80 million labels, and 600 classes, and therefore its direct use is difficult. There are many tools available to facilitate the process of loading certain dataset images, but each of them has serious drawbacks, such as the lack of segmentation support, the lack of visualization capabilities, and the inability to specify the file format. FiftyOne gives you the ability to fine-tune the parameters of images to upload, export them to dozens of different formats, visualize them, and even evaluate the effectiveness of machine learning models.
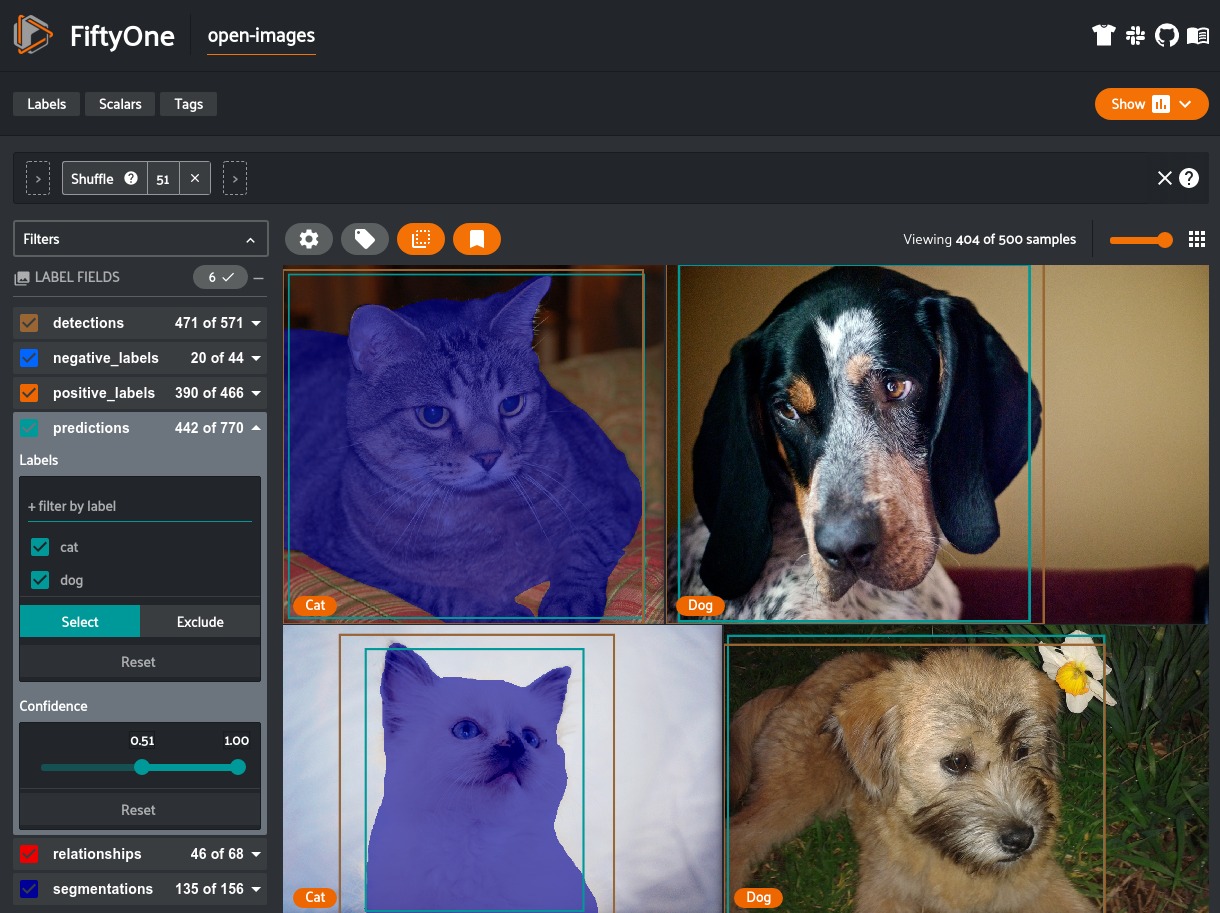
The integration of Open Images with FiftyOne allows you to choose how many and which images to upload, using a large number of filters that allow you to specify their specific classes and attributes. This allows you to create a separate dataset for each model without having to load all the Open Images or analyze raw file labels. Some of them are:
- label_types: the label type of the uploaded images. Possible values: “detections”, “classifications”, “relationships”, and “segmentations”;
- classes: classes of uploaded images (for example, “man”, “dog”, “cat”);
- max_samples: maximum number of images to import;
- shuffle: randomly changes the order of image downloads.
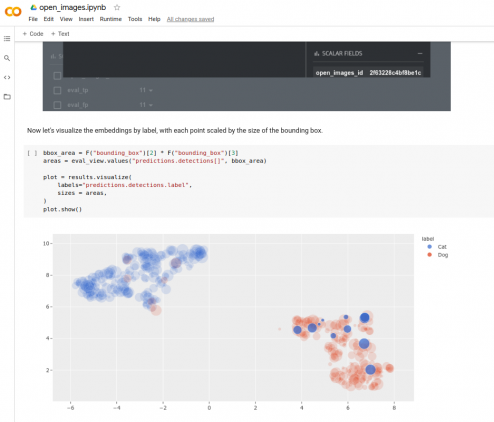
FiftyOne has the ability to export datasets in dozens of different formats (such as COCO, Pascal VOC, CVAT, YOLO, and TFRecords), which makes it easy to integrate them into existing workflows. FiftyOne also includes data visualization and a set of algorithms for evaluating the effectiveness of models. In particular, it is possible to plot the distribution of images in a low-dimensional space, which will allow you to quickly identify patterns, clusters and anomalies in the data (see Figure). This method of analysis is especially useful for Open Images datasets that contain automatically marked data: visualization and interactive analysis in vector space allows you to quickly determine which labels are placed incorrectly and require rechecking.