Salesforce has introduced Tableau Pulse – a platform that generates a personalized feed with key metric changes based on a Tableau user company’s dashboards. Tableau Pulse utilizes natural language queries and data visualization to display important indicators, their trends, and recommendations specific to each company’s data.
To generate the Tableau Pulse feed, Salesforce utilizes its internal language model, Salesforce Einstein GPT. The platform saves Tableau users time by showing data from multiple dashboards on one screen and highlighting notable metric changes.
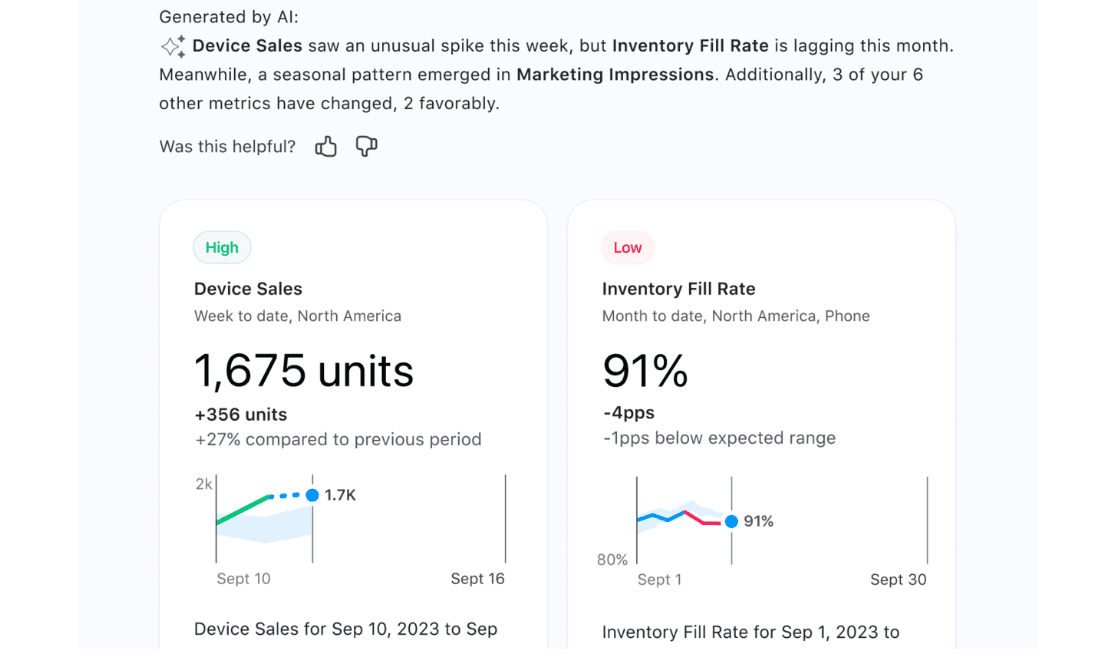
At the core of the platform is the Insight Summary feature, which generates personalized, language model-generated summaries of key data in natural language based on the indicators the user is monitoring. In particular, Insight Summary will alert users to unusual metric behavior – for example, a sharp decline in sales – and briefly describe changes to other target metrics without the need for manual dashboard review.
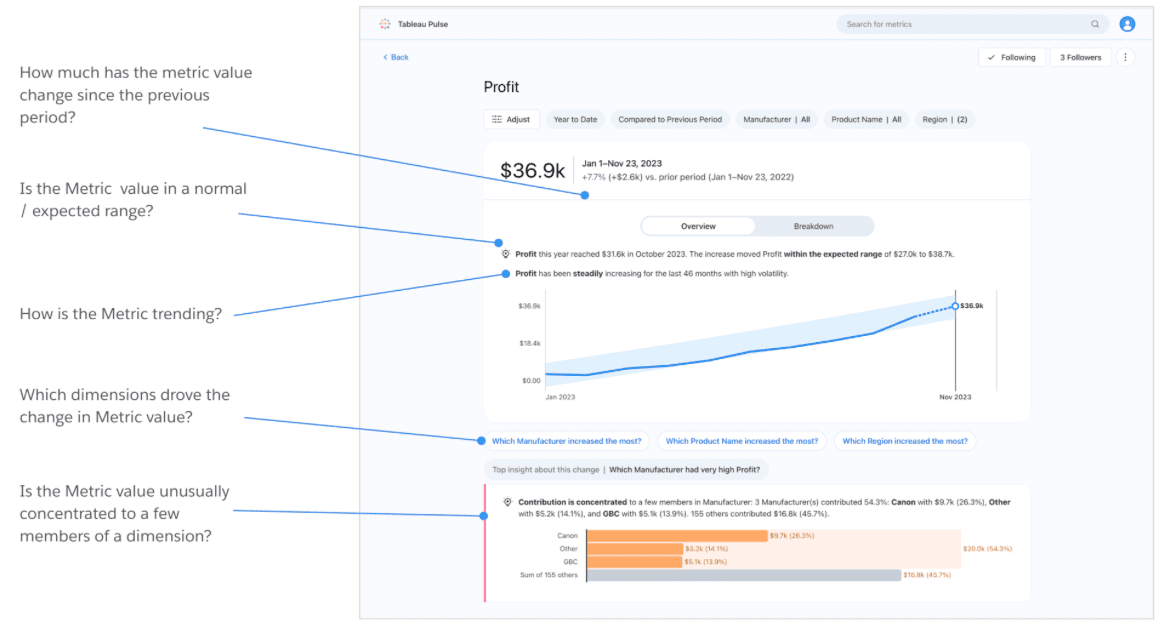
Tableau Pulse can also:
- Formulate in natural language whether metric changes are within a standard or expected range,
- Characterize the trend of metric changes in natural language,
- Suggest multiple queries, from which users can select to receive answers through more detailed data slices. For example, for a company’s “profit” metric, Pulse will suggest questions such as “which manufacturer’s sales increased the most?”, “which product’s sales increased the most?”, and “which region’s sales increased the most?”.
In addition to a standalone interface, users can receive Tableau Pulse summaries via email, Slack, and the Tableau mobile app. The platform is already available to corporate clients.