The Titanic competition is the classic first project on Kaggle: given data about 891 passengers, predict who survived the sinking of the Titanic in April 1912. It is small enough to understand completely and messy enough to teach the real work of machine learning: exploring data, filling in missing values, turning text into useful features, choosing a model and checking it honestly.
This tutorial walks through a complete solution in Python with pandas and scikit-learn, from the first look at the data to a submission file. We tested eight approaches with repeated cross-validation, from “everyone dies” to a random forest, and measured how much each step, especially feature engineering, actually adds.
Key takeaways
- The task: binary classification. Kaggle’s training file has 891 passengers with known outcomes; you predict survival for 418 more and submit a CSV file.
- Two baselines set the bar: predicting that everyone dies is right 61.6% of the time on the training data, and “women survive, men die” is right 78.7% of the time.
- Feature engineering matters most. A passenger’s title (Mr, Mrs, Miss, Master), family size and deck lifted logistic regression from 79.9% to 82.8% cross-validated accuracy.
- Models end up close together: logistic regression, a decision tree, a random forest and gradient boosting all scored between 82% and 84%. Sex, class, title and age carry most of the signal.
- Expect about 77% to 80% on the Kaggle leaderboard. Scores near 100% come from looking up the publicly known passenger lists, not from machine learning.
What is the Kaggle Titanic competition?
Kaggle is a platform for data science competitions, datasets and notebooks, owned by Google since 2017. Its “Titanic – Machine Learning from Disaster” competition is the standard starting point for beginners. It never ends, there is no prize, and the leaderboard is open to anyone. The point is to learn the workflow that every machine learning project follows.
The question behind the data is historical. When the Titanic struck an iceberg on 15 April 1912, there were not enough lifeboats for everyone on board. Of about 2,224 passengers and crew, more than 1,500 died. Survival was not random: the rule “women and children first” and the location of cabins, with first class closest to the boat deck, made some groups far more likely to survive. A model that learns these patterns can predict survival much better than chance.
In machine learning terms, this is supervised learning: a binary classification problem with a labelled training set. The metric is accuracy, the share of passengers whose fate you predict correctly.
The Titanic dataset
Kaggle provides three files: train.csv with 891 passengers and the Survived column, test.csv with 418 passengers without it, and gender_submission.csv, an example submission that predicts survival for every woman. The columns are:
| Column | Meaning | Example |
|---|---|---|
| PassengerId | Row identifier | 1 |
| Survived | Target: 1 = survived, 0 = died (train only) | 0 |
| Pclass | Ticket class: 1 = first, 2 = second, 3 = third | 3 |
| Name | Full name, including a title | Braund, Mr. Owen Harris |
| Sex | male or female | male |
| Age | Age in years (missing for 177 passengers) | 22 |
| SibSp | Number of siblings and spouses aboard | 1 |
| Parch | Number of parents and children aboard | 0 |
| Ticket | Ticket number | A/5 21171 |
| Fare | Ticket price in pounds | 7.25 |
| Cabin | Cabin number (missing for 687 passengers) | C85 |
| Embarked | Port: C = Cherbourg, Q = Queenstown, S = Southampton | S |
Step 1: explore the data
Before training anything, look at the data. Three things stand out in the training set:
- Missing values. Age is missing for 177 passengers (20%), Cabin for 687 (77%) and Embarked for 2. Any model needs a plan for them.
- Class imbalance. Only 38.4% of the passengers in the file survived, so a model that always predicts death is already right 61.6% of the time. That is the floor every model must beat.
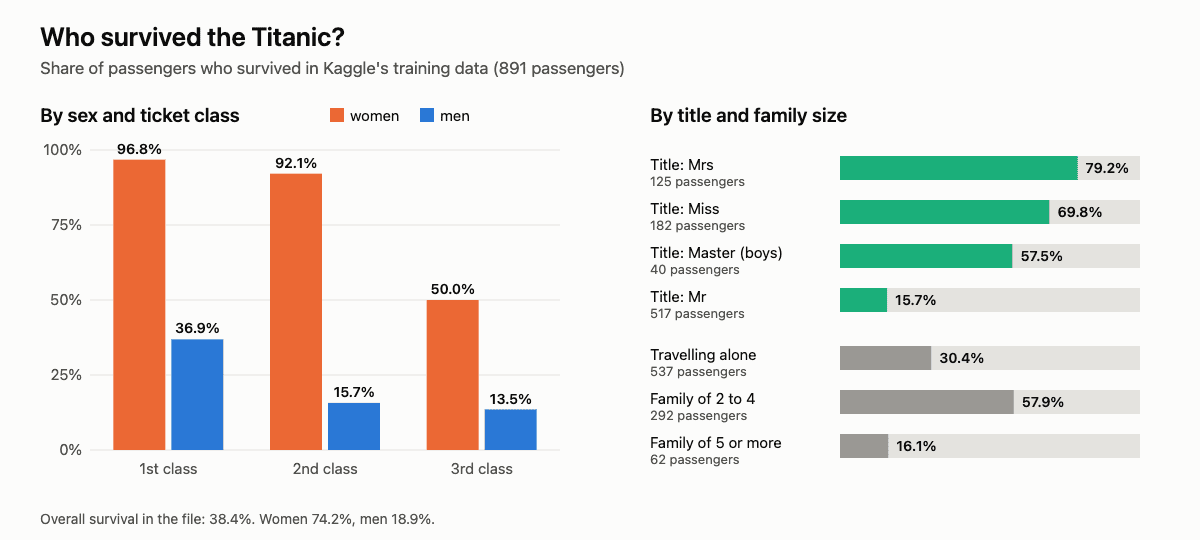
- Strong, simple patterns. 74.2% of women survived against 18.9% of men. By class, 63.0% of first-class passengers survived, 47.3% of second class and 24.2% of third class.
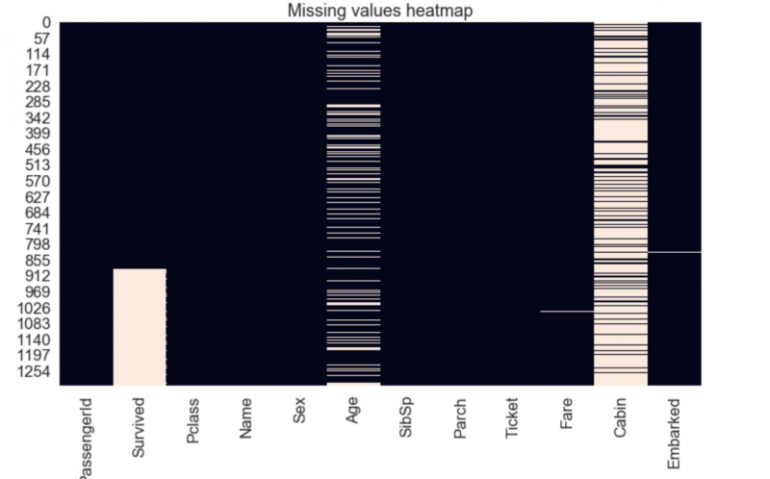
The combination of sex and class is even more telling: 96.8% of women in first class survived, but only 50.0% of women in third class; among men, 36.9% survived in first class and 13.5% in third. Children also did better: 61.3% of the 62 passengers under 10 survived. These numbers suggest which features a model will rely on.
Step 2: feature engineering
Feature engineering means turning raw columns into inputs that make patterns easy to learn. On the Titanic, a few classic ideas make a large difference:
- Title from the name. “Braund, Mr. Owen Harris” contains the title “Mr”. Titles combine sex, age and social status: 15.7% of men addressed as Mr survived, but 57.5% of boys addressed as Master, and 79.2% of women addressed as Mrs. Rare titles such as Dr, Rev, Col or Countess are grouped together.
- Family size. SibSp + Parch + 1. Passengers travelling alone survived 30.4% of the time, families of two to four 57.9%, and large families of five or more only 16.1%: small families stuck together and found places in the boats; large families, mostly in third class, struggled.
- Deck from the cabin. The first letter of the cabin number is the deck (A to G). Having any recorded cabin is informative in itself: 66.7% of passengers with a known cabin survived against 30.0% without, because cabin numbers were recorded mainly for first-class passengers.
- Filling missing ages by title. Instead of one median for everybody, each passenger gets the median age of their title group, so a missing “Master” becomes a child and a missing “Mrs” an adult.
- Log of the fare. Fares range from 0 to over 500 pounds; the logarithm reduces the influence of a few very expensive tickets.
Categorical columns such as sex, class, title, port and deck are converted to numbers with one-hot encoding, and numeric columns are standardised so that logistic regression treats them on the same scale.
Step 3: models and cross-validation
We compared four classic algorithms, all available in scikit-learn:
- Logistic regression, a linear model that estimates the probability of survival; a strong, interpretable baseline (a close relative of linear regression for classification).
- A decision tree limited to depth 4, which learns human-readable rules such as “if male and adult, then died”.
- A random forest of 500 trees, which averages many trees trained on random subsets of the data.
- Gradient boosting, which builds trees one after another, each correcting the errors of the previous ones.
With only 891 passengers, a single train/test split gives noisy results: moving a few dozen passengers between the sets changes the score by several points. We used 5-fold cross-validation repeated 10 times: the data is split into five parts, each part serves once as the test set, and the whole procedure is repeated with 10 different shuffles, giving 50 scores per model. We report their mean and standard deviation. Encoding and scaling sit inside a scikit-learn pipeline, so they are fitted only on the training folds. For simplicity, the title-based median ages are computed once on the whole file, which leaks a negligible amount of information into the test folds.
The code needs pandas, NumPy and scikit-learn. Download train.csv from the Titanic competition page on Kaggle (a free account is needed) into a data folder. The script runs in about a minute.
import numpy as np
import pandas as pd
from sklearn.compose import make_column_transformer
from sklearn.ensemble import HistGradientBoostingClassifier, RandomForestClassifier
from sklearn.inspection import permutation_importance
from sklearn.linear_model import LogisticRegression
from sklearn.model_selection import RepeatedStratifiedKFold, cross_val_score, train_test_split
from sklearn.pipeline import make_pipeline
from sklearn.preprocessing import OneHotEncoder, StandardScaler
from sklearn.tree import DecisionTreeClassifier

# 1. Data: Kaggle's train.csv, 891 passengers with known outcome
df = pd.read_csv("data/train.csv")
print(f"{len(df)} passengers, {df.Survived.mean():.1%} survived")
print("missing values:", df.isna().sum()[lambda s: s > 0].to_dict())
print(df.groupby("Sex").Survived.mean().round(3).to_dict(), df.groupby("Pclass").Survived.mean().round(3).to_dict())

# 2. Feature engineering
def features(d):
    d = d.copy()
    d["Title"] = d.Name.str.split(",").str[1].str.split(".").str[0].str.strip()  # "Braund, Mr. Owen" -> "Mr"
    d["Title"] = d.Title.replace({"Mlle": "Miss", "Ms": "Miss", "Mme": "Mrs"})
    d.loc[~d.Title.isin(["Mr", "Mrs", "Miss", "Master"]), "Title"] = "Rare"
    d["FamilySize"] = d.SibSp + d.Parch + 1
    d["IsAlone"] = (d.FamilySize == 1).astype(int)
    d["Deck"] = d.Cabin.str[0].fillna("Unknown")                  # 77% of cabins are unknown
    d["Embarked"] = d.Embarked.fillna("S")
    d["Age"] = d.Age.fillna(d.groupby("Title").Age.transform("median"))  # 20% of ages are missing
    d["LogFare"] = np.log1p(d.Fare)
    return d

raw = df[["Sex", "Pclass", "SibSp", "Parch", "Fare"]].assign(Age=df.Age.fillna(df.Age.median()),
                                                       Embarked=df.Embarked.fillna("S"))
df = features(df)
categorical = ["Sex", "Pclass", "Title", "Embarked", "Deck"]
numeric = ["Age", "SibSp", "Parch", "FamilySize", "IsAlone", "LogFare"]
X, y = df[categorical + numeric], df.Survived
prep = make_column_transformer((OneHotEncoder(handle_unknown="ignore"), categorical), (StandardScaler(), numeric))

# 3. Models, compared with 5-fold cross-validation repeated 10 times (50 train/test splits)
models = {
    "Logistic regression": LogisticRegression(max_iter=1000),
    "Decision tree (depth 4)": DecisionTreeClassifier(max_depth=4, random_state=0),
    "Random forest": RandomForestClassifier(500, max_depth=7, min_samples_leaf=2, random_state=0),
    "Gradient boosting": HistGradientBoostingClassifier(max_depth=3, learning_rate=0.05, max_iter=200, random_state=0),
}
cv = RepeatedStratifiedKFold(n_splits=5, n_repeats=10, random_state=0)
print(f"{'Everyone dies (majority class)':32s} accuracy {1 - y.mean():.3f}")
print(f"{'Women survive, men die':32s} accuracy {((df.Sex == 'female') == y).mean():.3f}")

# Raw columns only (missing ages filled with the median), as a reference point: no titles, family size or deck
raw_prep = make_column_transformer((OneHotEncoder(), ["Sex", "Pclass", "Embarked"]), remainder=StandardScaler())
for name in ["Logistic regression", "Gradient boosting"]:
    scores = cross_val_score(make_pipeline(raw_prep, models[name]), raw, y, cv=cv)
    print(f"{name + ', raw columns':32s} accuracy {scores.mean():.3f} +/- {scores.std():.3f}")
for name, model in models.items():
    scores = cross_val_score(make_pipeline(prep, model), X, y, cv=cv)
    print(f"{name:32s} accuracy {scores.mean():.3f} +/- {scores.std():.3f}")

# 4. Which features matter? Permutation importance on a held-out 25%
X_tr, X_te, y_tr, y_te = train_test_split(X, y, test_size=0.25, stratify=y, random_state=0)
gb = make_pipeline(prep, models["Gradient boosting"]).fit(X_tr, y_tr)
imp = permutation_importance(gb, X_te, y_te, n_repeats=30, random_state=0)
for col, value in sorted(zip(X.columns, imp.importances_mean), key=lambda t: -t[1]):
    print(f"  {col:11s} accuracy drop when shuffled: {value:.3f}")
891 passengers, 38.4% survived
missing values: {'Age': 177, 'Cabin': 687, 'Embarked': 2}
{'female': 0.742, 'male': 0.189} {1: 0.63, 2: 0.473, 3: 0.242}
Everyone dies (majority class) accuracy 0.616
Women survive, men die accuracy 0.787
Logistic regression, raw columns accuracy 0.799 +/- 0.024
Gradient boosting, raw columns accuracy 0.823 +/- 0.025
Logistic regression accuracy 0.828 +/- 0.022
Decision tree (depth 4) accuracy 0.823 +/- 0.024
Random forest accuracy 0.834 +/- 0.025
Gradient boosting accuracy 0.832 +/- 0.022
Sex accuracy drop when shuffled: 0.130
Pclass accuracy drop when shuffled: 0.063
Title accuracy drop when shuffled: 0.047
Age accuracy drop when shuffled: 0.035
FamilySize accuracy drop when shuffled: 0.014
LogFare accuracy drop when shuffled: 0.013
Deck accuracy drop when shuffled: 0.011
Embarked accuracy drop when shuffled: 0.006
SibSp accuracy drop when shuffled: 0.004
IsAlone accuracy drop when shuffled: 0.000
Parch accuracy drop when shuffled: -0.002Results: what each step adds
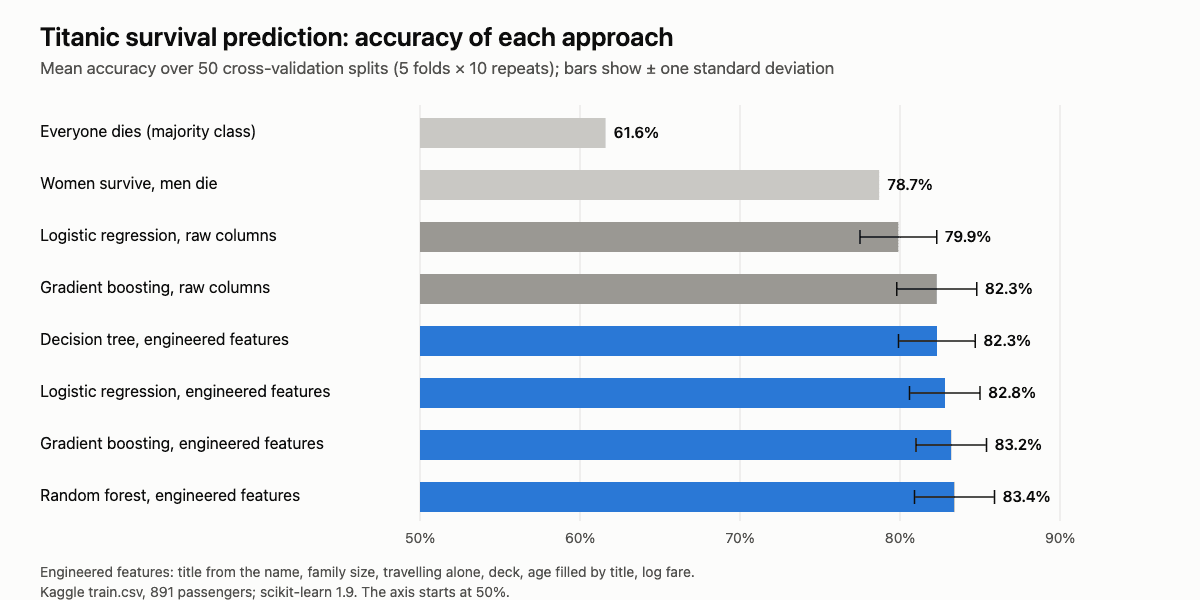
- The gender baseline is hard to beat by much. “Women survive, men die” alone is right 78.7% of the time on the training data. Every model above has to earn its extra few points.
- Feature engineering helps the simple model most. With raw columns, logistic regression reached 79.9%; with title, family size, deck and title-based age, 82.8%. Gradient boosting gained less (82.3% to 83.2%), because trees can find some interactions on their own, but engineered features still helped.
- The choice of algorithm matters less than you might expect. All four models with engineered features scored between 82.3% and 83.4%, and the differences are smaller than the standard deviation of about 2.3 points across folds. The random forest was best on average, but not reliably.
- Sex, class, title and age do the work. In a permutation test on a held-out quarter of the data, shuffling the Sex column cut the gradient boosting model’s accuracy by 13.0 points, Pclass by 6.3, Title by 4.7 and Age by 3.5. Parch and IsAlone added nothing on top of FamilySize.
The lesson carries over to real projects: understanding the data and building good features usually beats searching for a cleverer algorithm, especially on small tabular data sets.
Step 4: make a Kaggle submission
To submit, train the chosen model on all 891 training passengers, apply the same features() function to test.csv (it has one missing fare, which you can fill with the median fare of the passenger’s class) and save a CSV file with two columns, PassengerId and Survived, one row for each of the 418 test passengers. Upload it on the competition page under “Submit Prediction”; the score appears within seconds.
Three things to know about the score:
- Expect a lower number than in cross-validation. The leaderboard scores your predictions on the test passengers, who differ slightly from the training set. Kaggle’s own
gender_submission.csvscores about 76.6%, and well-built models typically land between 77% and 80%. A drop of two or three points from your cross-validated accuracy is normal. - Do not chase the leaderboard. With 418 test passengers, one more correct answer is worth 0.24 points. Repeatedly tweaking a model to raise the public score overfits to those passengers and teaches the wrong habits.
- Perfect scores are not real. The full passenger and survivor lists of the Titanic are public, and some leaderboard entries simply copy the true answers. A score above about 85% almost certainly does not come from a model.
Tips and next steps
- Always start with a baseline, such as the majority class or a one-rule model, so you know what “good” means.
- Use cross-validation, not a single split, on small data sets, and keep all preprocessing inside the pipeline to avoid leaking information from the test folds.
- Read other people’s notebooks. Kaggle’s public notebooks for the Titanic show dozens of approaches, from ticket-group features to stacked models; reproducing and questioning them is the fastest way to learn.
- Move on to the next Getting Started competitions: House Prices (regression on tabular data), Spaceship Titanic (a larger, modern remake of the same problem) and Digit Recognizer (images, a first step towards convolutional neural networks).
FAQ
What is a good score on Kaggle Titanic?
Around 77% to 80% accuracy on the leaderboard is a solid, honest result. The gender-only baseline scores about 76.6%, so anything above it shows that your model learned more than “women survived”. Scores close to 100% come from copying publicly available passenger records.
How many people survived the Titanic?
Of roughly 2,224 people on board, more than 1,500 died and about 700 survived. In Kaggle’s training file, 342 of the 891 passengers (38.4%) survived; the crew is not included in the competition data.
Which algorithm is best for Titanic?
There is no clear winner. In our tests, logistic regression, a decision tree, a random forest and gradient boosting all reached 82% to 83% cross-validated accuracy once the features were engineered. Spend your time on features and validation rather than on exotic models.
Is the Titanic dataset good for beginners?
Yes. It is small, the columns are easy to understand, and it covers the essential steps of a machine learning project: exploration, missing values, categorical encoding, feature engineering, model comparison and validation. It is also one of the most discussed data sets on the internet, so help is easy to find.
Can I use deep learning for the Titanic competition?
You can, but it rarely helps. With 891 rows and a dozen columns, neural networks have little to learn from and tend to overfit; tree-based models and logistic regression are faster and at least as accurate on small tabular data.