
Big data means data sets that are too large, too fast-growing or too varied to store and analyse with traditional tools on a single computer. Every search, card payment, app tap, sensor reading and video upload adds to it. Companies use big data to recommend products, detect fraud, run supply chains and, increasingly, to train artificial intelligence: today’s large language models learn from trillions of words collected from the web.
This guide explains what big data is, the “Vs” that define it, the types of data involved, how big data is stored and processed, from Hadoop to Spark, data lakes and lakehouses, and where it is used. We also ran our own experiment to answer a practical question: at what point does data become “big” for an ordinary computer? We analysed an e-commerce event log of 1 to 300 million rows with pandas, Polars and DuckDB on a machine with 7 GB of memory, and measured where each tool breaks.
Key takeaways
- Big data is defined less by an exact size than by the point where data outgrows the memory, storage or speed of conventional tools.
- The 5 Vs: volume (how much), velocity (how fast it arrives), variety (structured, semi-structured and unstructured), veracity (how reliable) and value (what it is worth).
- The technology moved from Hadoop clusters to Spark, cloud data warehouses and open lakehouses built on Parquet and Apache Iceberg.
- In our test, pandas ran out of 7 GB of memory at 100 million rows (1.4 GB on disk), while DuckDB and Polars processed 300 million rows (4.3 GB on disk) in under 30 seconds on a two-core machine.
- Big data and AI feed each other: machine learning needs large data sets, and AI is now the main tool for making sense of them.
What is big data?
There is no official size at which data becomes “big”. The term describes a practical situation: the data has grown beyond what conventional software can handle in reasonable time and cost. A spreadsheet tops out at about a million rows; a laptop’s memory at a few gigabytes; a single database server at what fits on its disks and what its processors can scan. When you hit those limits, you need different methods: splitting the data across many machines, processing it in streams, or using storage formats and engines designed for scale.
So big data is a moving target. In the early 2000s, a terabyte was huge; today a laptop can analyse hundreds of millions of rows, as our experiment below shows, while internet companies, scientific instruments and AI labs work with petabytes and exabytes. What stays constant is the idea: data whose size, speed or complexity requires special tools and creates value that smaller data cannot.
The benefits that make organisations invest in it:
- Combining many sources: transactions, website clicks, CRM records, sensors and social media in one place.
- Real-time decisions: detecting fraud while a payment is being made, adjusting prices or routes as conditions change.
- Finding patterns that small samples miss, such as rare failure modes or small customer segments.
- Training AI models, which improve with more data.
- Better risk management, from credit scoring to predictive maintenance.
The 5 Vs of big data
In 2001, analyst Doug Laney of META Group (later part of Gartner) described data management challenges along three dimensions: volume, velocity and variety. Later writers added more Vs; the most common list today has five:
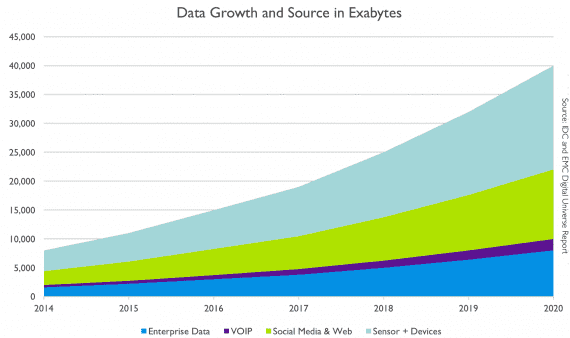
- Volume: the amount of data. It is the defining property, measured in terabytes, petabytes (thousands of terabytes) and exabytes (millions of terabytes). In 2018 the research firm IDC forecast that the world would create 175 zettabytes of data a year by 2025; one zettabyte is a billion terabytes.
- Velocity: the speed at which data arrives and must be processed. Click streams, financial ticks, sensor readings and logs arrive continuously, and many decisions must be made in milliseconds.
- Variety: the range of formats and sources: database tables, JSON from APIs, emails, documents, images, audio and video.
- Veracity: how trustworthy the data is. Large data sets contain errors, duplicates, gaps, bias and outright fakes, and more data does not fix bad data.
- Value: the business or scientific benefit. Storing data costs money; it is worth keeping only if it can be turned into decisions, products or knowledge.
Some authors add variability (data whose meaning or flow changes over time, such as seasonal peaks or slang that changes the meaning of words) and visualisation, but the five above are the standard set.
Types of big data: structured, unstructured, semi-structured
Structured data
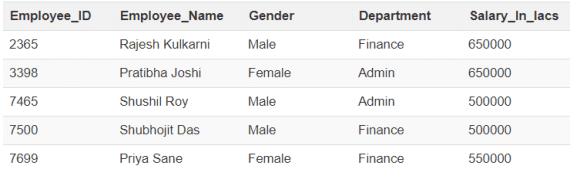
Structured data has a fixed format, usually rows and columns with defined data types, like a table of employees, orders or bank transactions. It lives in relational databases and data warehouses and is queried with SQL. It is the easiest kind to analyse, and decades of database research have made it efficient even at enormous scale.
Unstructured data
Unstructured data has no predefined model: free text, emails, PDFs, images, audio, video, web pages. It makes up the majority of the data organisations produce and is the hardest to analyse with traditional tools. This is exactly where modern AI has changed the picture: language and vision models can now read contracts, transcribe calls, describe images and turn unstructured data into structured fields at scale.
Semi-structured data
Semi-structured data has some organisation, such as tags or key-value pairs, but no rigid table schema. JSON from web APIs, XML files, logs and emails with headers are typical examples. Each record can have different fields, which makes the format flexible but harder to query than a table:
{"user_id": 4815, "event": "purchase", "items": [{"sku": "A12", "price": 19.99}], "device": "mobile"}
{"user_id": 1623, "event": "page_view", "url": "/sale", "referrer": "newsletter"}
Big data examples
- Internet platforms: search engines, social networks and video services log every query, view and click from billions of users and use the data for ranking, recommendations and advertising.
- Finance: stock exchanges record every order and trade; banks analyse card transactions in real time to stop fraud.
- Science: the experiments at CERN’s Large Hadron Collider filter about a billion particle collisions per second down to the events worth keeping, and CERN’s data centre passed an exabyte of storage in 2023. Genome sequencing, astronomy and climate simulation also produce petabytes.
- Industry and transport: aircraft engines, wind turbines and factory machines stream sensor data that is used to predict failures before they happen; logistics companies track every parcel and vehicle.
- Healthcare: medical images, electronic health records and wearable devices support diagnosis, research and hospital planning.
- AI training: Common Crawl, a public archive of the web, adds billions of web pages with each crawl, and Meta trained its Llama 3 models in 2024 on more than 15 trillion tokens of text. Training data for frontier models is one of the largest big data pipelines in existence.
Big data technologies: from Hadoop to the lakehouse
The tools changed a lot in twenty years, but the ideas behind them are stable: split the data, process the parts in parallel, and move computation to where the data is.
Hadoop and MapReduce
In 2003 and 2004 Google published papers on its distributed file system (GFS) and the MapReduce programming model, which processed huge data sets on thousands of cheap servers. Engineers at Yahoo turned these ideas into the open-source Apache Hadoop project in 2006. Hadoop’s HDFS stored files across a cluster, and MapReduce jobs processed them in two phases: map (process each piece) and reduce (combine the results). For a decade Hadoop was almost a synonym for big data. It was powerful but slow and complex to program, because every step wrote its results to disk.
Apache Spark
Apache Spark, created at UC Berkeley’s AMPLab in 2009, keeps intermediate data in memory and offers high-level APIs in Python, SQL, Scala and R. It is many times faster than MapReduce for iterative jobs such as machine learning and became the standard engine for large-scale data processing. Spark 4, released in 2025, continues to be one of the most widely used open-source data tools.
Streaming
For data in motion, Apache Kafka acts as a durable log that collects events from thousands of sources, and engines such as Apache Flink and Spark Structured Streaming process them continuously, for example to update fraud scores or dashboards within seconds.
Data warehouses, data lakes and lakehouses
- A data warehouse stores cleaned, structured data in tables optimised for SQL analytics. Cloud warehouses such as Snowflake, Google BigQuery, Amazon Redshift and Azure Synapse separate storage from compute so that capacity can grow on demand.
- A data lake stores raw data of any type cheaply in object storage such as Amazon S3, usually as files. It is flexible, but without care it turns into a “data swamp” where nobody knows what is reliable.
- A lakehouse combines both: data stays in open files in cheap storage, while open table formats such as Apache Iceberg, Delta Lake and Apache Hudi add database features on top, including transactions, schema changes and time travel to earlier versions. Iceberg, created at Netflix, has become the de facto standard, supported by Snowflake, Databricks, Google, AWS and others, so many engines can work on the same tables.
Underneath most of these systems is the same file format: Apache Parquet, which stores data by column and compresses it well. An engine that needs three columns out of fifty reads only those three, which is a major reason modern analytics is fast.
“Big data on a laptop”: DuckDB and Polars
The newest trend runs in the opposite direction. Laptops and single servers now have many cores, large memory and fast SSDs, and new engines use them so well that many “big data” jobs no longer need a cluster. DuckDB is an in-process SQL database for analytics, often described as SQLite for analytics; Polars is a DataFrame library written in Rust. Both read Parquet directly, use all CPU cores and can process data larger than memory by streaming it in chunks. Our experiment shows what that means in practice.
Experiment: when does data become “big”?
We generated a synthetic e-commerce event log: each row records a user, a product, a product category, a price and a timestamp from 2026, as an online shop or analytics system would. We created four versions with 1, 10, 100 and 300 million rows, stored as compressed Parquet files of 0.01 to 4.3 GB. The data generator writes the file in chunks of 10 million rows, so creating it never needs much memory. Run it as python generate.py 100000000 to get the 100-million-row file:
import sys
import numpy as np
import pyarrow as pa
import pyarrow.parquet as pq

def generate(rows, path, chunk=10_000_000, seed=0):
    """A synthetic e-commerce event log: who bought what, in which category, for how much, and when."""
    rng = np.random.default_rng(seed)
    start = np.datetime64("2026-01-01T00:00:00", "s").astype(np.int64)
    writer = None
    for done in range(0, rows, chunk):
        n = min(chunk, rows - done)
        table = pa.table({
            "user_id": rng.integers(0, 5_000_000, n, dtype=np.int32),
            "product_id": rng.integers(0, 200_000, n, dtype=np.int32),
            "category": rng.zipf(1.5, n).clip(1, 200).astype(np.int16),      # a few big categories, a long tail
            "price": np.round(rng.lognormal(3.0, 1.0, n), 2).astype(np.float32),
            "event_time": pa.array(start + rng.integers(0, 273 * 86400, n), pa.timestamp("s")),
        })
        writer = writer or pq.ParquetWriter(path, table.schema, compression="zstd")
        writer.write_table(table)
    writer.close()

if __name__ == "__main__":
    rows = int(sys.argv[1])
    generate(rows, f"events_{rows // 1_000_000}m.parquet")
Then we ran one typical analytical query with three tools: for each category, count orders, sum revenue and count distinct buyers, and return the top three categories by revenue. Counting distinct buyers is deliberately demanding, because the engine has to remember every user ID it has seen per category.
import resource
import sys
import time

tool, path = sys.argv[1], sys.argv[2]
start = time.perf_counter()

if tool == "pandas":                         # loads the whole table into memory, then aggregates
    import pandas as pd
    df = pd.read_parquet(path)
    result = (df.groupby("category").agg(orders=("price", "size"), revenue=("price", "sum"),
                                         buyers=("user_id", "nunique"))
                .sort_values("revenue", ascending=False).head(3))
elif tool == "polars":                       # lazy query, executed in streaming batches
    import polars as pl
    result = (pl.scan_parquet(path).group_by("category")
                .agg(orders=pl.len(), revenue=pl.col("price").cast(pl.Float64).sum(), buyers=pl.col("user_id").n_unique())
                .sort("revenue", descending=True).head(3).collect(engine="streaming"))
elif tool == "duckdb":                       # SQL engine that reads the file in parallel chunks
    import duckdb
    result = duckdb.sql(f"""
        SELECT category, count(*) AS orders, sum(price) AS revenue, count(DISTINCT user_id) AS buyers
        FROM '{path}' GROUP BY category ORDER BY revenue DESC LIMIT 3""").df()

seconds = time.perf_counter() - start
peak_gb = resource.getrusage(resource.RUSAGE_SELF).ru_maxrss / 1024 ** 2
print(f"{tool},{seconds:.1f},{peak_gb:.2f}")
print(result, file=sys.stderr)
Each query ran in a separate process on a cloud machine with two CPU cores and 7 GB of memory, while a small monitor measured peak memory use and stopped any run that got close to the limit. The results:
   1m rows (0.01 GB on disk)  pandas     1.1 s, peak RAM 0.23 GB
   1m rows (0.01 GB on disk)  polars     0.2 s, peak RAM 0.09 GB
   1m rows (0.01 GB on disk)  duckdb     0.6 s, peak RAM 0.18 GB
  10m rows (0.14 GB on disk)  pandas     4.9 s, peak RAM 1.13 GB
  10m rows (0.14 GB on disk)  polars     0.7 s, peak RAM 0.35 GB
  10m rows (0.14 GB on disk)  duckdb     1.6 s, peak RAM 0.46 GB
 100m rows (1.42 GB on disk)  pandas  out of memory (peak seen 5.8 GB)
 100m rows (1.42 GB on disk)  polars     6.0 s, peak RAM 2.41 GB
 100m rows (1.42 GB on disk)  duckdb    11.6 s, peak RAM 2.20 GB
 300m rows (4.25 GB on disk)  pandas  out of memory (peak seen 5.8 GB)
 300m rows (4.25 GB on disk)  polars    28.1 s, peak RAM 5.32 GB
 300m rows (4.25 GB on disk)  duckdb    27.5 s, peak RAM 3.42 GB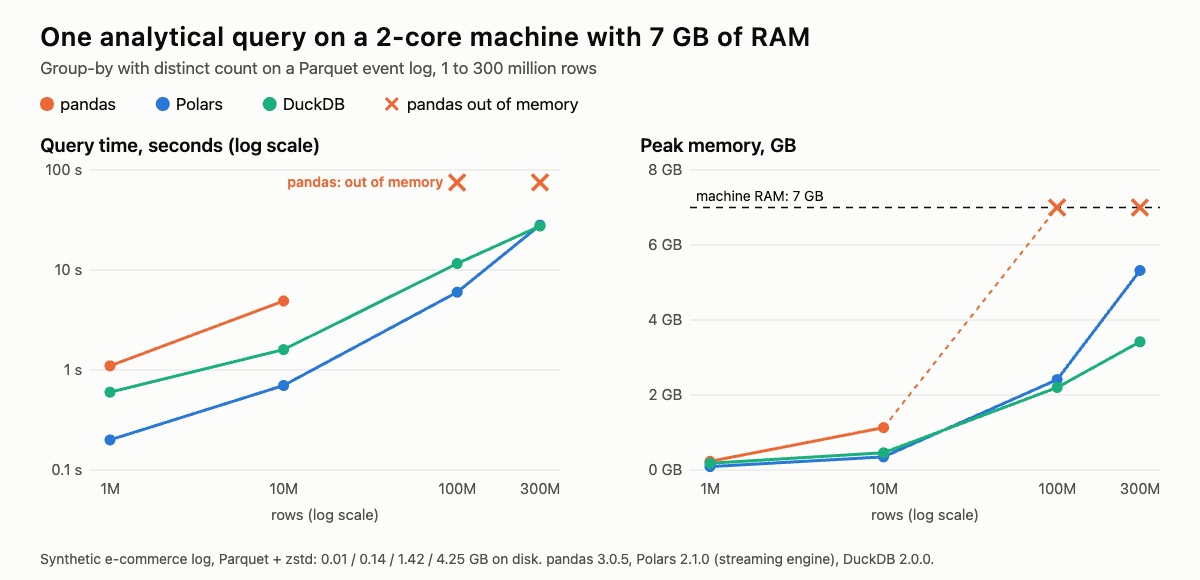
What this shows:
- The memory wall is real and arrives early. pandas loads the whole table into memory and then makes working copies during the group-by. At 10 million rows it already needed 1.13 GB, about eight times the file size on disk; at 100 million rows it exhausted the 7 GB machine and the operating system killed it. A 1.4 GB file was “big data” for pandas on this computer.
- Columnar, streaming engines push the limit far further. DuckDB and Polars read only the columns they need, process the file in batches and use both cores. Both handled 300 million rows, three times more than what broke pandas, in under 30 seconds. DuckDB used the least memory at that size, 3.4 GB; Polars was the fastest on smaller files.
- Speed differs by an order of magnitude. On 10 million rows, Polars answered in 0.7 seconds and DuckDB in 1.6 seconds, versus 4.9 seconds for pandas.
- The query matters as much as the size. Counting distinct users is what pushed Polars to 5.3 GB on 300 million rows; a simple sum would need far less. Beyond the capacity of one machine, the same query moves to Spark or a cloud warehouse, which spread the work over many machines.
The practical lesson: before building a cluster, try a modern single-machine engine on Parquet files. Many companies’ “big data” fits comfortably on one good server in 2026, and a cluster becomes necessary only at terabytes, for many concurrent users or for continuous streaming.
Big data analytics and AI
Big data analytics is the process of examining large data sets to find patterns, trends and relationships. It usually falls into four levels:
- Descriptive: what happened? Dashboards and reports, such as revenue by category in our experiment.
- Diagnostic: why did it happen? Drilling into segments, correlations and anomalies.
- Predictive: what will happen? Machine learning models forecast demand, churn, failures or fraud.
- Prescriptive: what should we do? Optimisation and AI systems recommend or take actions, such as adjusting prices or rerouting deliveries.
Big data and artificial intelligence depend on each other. Machine learning models, from gradient boosting on transaction tables to deep neural networks on images and text, become more accurate with more data, and large language models exist only because of web-scale data sets. In the other direction, AI makes big data usable: it extracts structure from unstructured documents, lets people query data in plain English instead of SQL, and flags anomalies that no human would spot in billions of rows. Training on big data needs serious hardware; see our guides to the best GPU for AI and to cloud GPU pricing.
Challenges: quality, privacy and cost
- Data quality. Duplicates, missing values, inconsistent formats and outdated records multiply with scale. Data engineering, the work of cleaning, validating and documenting data, typically takes most of the effort in analytics and AI projects.
- Privacy and regulation. Personal data is governed by laws such as the EU’s GDPR, which requires a legal basis for processing, data minimisation and the right to deletion. The EU AI Act adds data governance requirements for high-risk AI systems.
- Security. Large central stores of data are attractive targets for attackers, so access control, encryption and auditing are essential.
- Cost and energy. Storage is cheap per gigabyte, but compute, data transfer and duplicated copies add up quickly in the cloud. Data centres also consume a growing share of electricity, especially with AI workloads.
- Skills and complexity. Modern data stacks combine many tools. Choosing the simplest tool that meets the need, as our experiment suggests, often saves the most.
FAQ
What is big data in simple words?
Big data is information that is too large, arrives too fast or is too varied to handle with ordinary tools such as a spreadsheet or a single database. It needs special methods to store and analyse, and it is valuable because patterns in it can improve decisions and train AI.
How big is big data?
There is no fixed threshold. Data becomes “big” when it outgrows the tools you use: in our test, a 1.4 GB file with 100 million rows was too big for pandas on a 7 GB machine but easy for DuckDB and Polars. Large organisations work with terabytes and petabytes, the largest internet and AI companies with exabytes.
What are the 5 Vs of big data?
Volume (the amount of data), velocity (the speed it arrives at), variety (different formats and sources), veracity (how accurate and trustworthy it is) and value (the benefit it brings).
What are examples of big data?
Search and social media activity, card payments and stock trades, sensor data from machines and vehicles, medical records and images, scientific data from particle physics and astronomy, and the web-scale text and image collections used to train AI models.
What is the difference between big data and data science?
Big data describes the data and the technology for storing and processing it at scale. Data science is the discipline of extracting knowledge from data with statistics, machine learning and domain knowledge, whether the data is big or small.
Is Hadoop still used?
Hadoop’s ideas shaped the field, and some organisations still run Hadoop clusters, but new projects mostly use Apache Spark, cloud data warehouses and lakehouses built on object storage with open formats such as Parquet and Iceberg.